Grid impacts of heat pumps, EVs and solar revealed
Comment by Will Rowe, Data Scientist at Energy Systems Catapult.
As we transition to Net Zero, real-world smart-meter data from homes using low-carbon technologies (LCTs) delivers insights that theory and modelling alone can’t match. From our 2,300 Living Lab participants who currently share their smart meter data with us, we identified 647 homes with over a year of high-quality data (excluding those bound by other trial terms), each with different LCT combinations. This dataset lets us isolate and compare the actual consumption impacts of individual technologies.
The homes and their technologies
We grouped the homes based on their low-carbon technologies:
230 homes with no low-carbon technologies (LCTs, including electric vehicles (EVs), heat pumps, solar PV, and batteries) (our baseline)
142 homes with EVs and home chargers
72 homes with solar panels, batteries, and EVs
47 homes with everything: heat pumps, solar, batteries, and EVs
The remaining homes had different combinations, giving us a rich dataset to compare how each technology affects energy use.
Our approach: By comparing consumption patterns between groups of homes with different combinations of technologies we isolate technology-specific impacts.
In a nutshell: if “Solar + EV” homes use X kWh, and “Solar only” homes use Y kWh, then the difference (X minus Y) tells us about the EV’s contribution to demand. Doing this across many combinations gave us a clearer picture of each technology’s individual impact. The contributions were weighting evenly for each combination of technologies.
Electric vehicles: demand shifting and seasonal variation
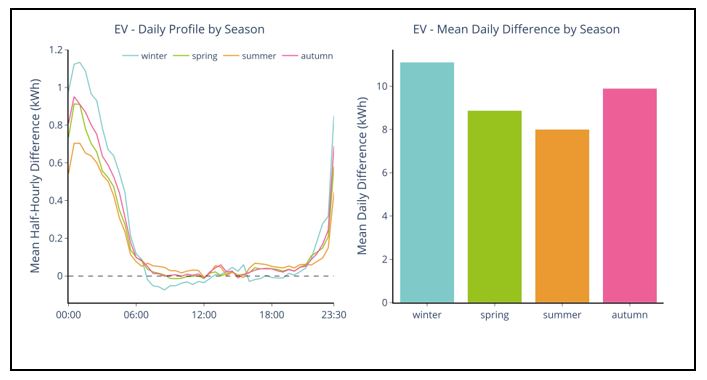
Figure one: Difference in energy import attributed to EV charging
Load profile impact: Unsurprisingly, EV charging creates a pronounced overnight demand peak with much lower daytime impact. Peak charging occurs between midnight and 6am, consistent with behaviour optimising for current time-of-use tariffs.
Seasonal changes: We also see significant seasonal variation. Compared to summer baseline, we see a 34% increase in daily mean consumption during winter and lower but still substantial increases (22% and 11%) in autumn and spring.
This variation reflects both weather-dependent efficiency (cars use more energy in cold, wet weather) and potential behavioural changes (people opt to drive when it’s cold and wet). For network planners, this suggests winter demand from EV charging will be substantially higher than summer requirements.
System implications: The strong overnight clustering of EV demand demonstrates consumer responsiveness to price signals, but seasonal differences suggest EV demand will be highest during already constrained periods.
Heat pumps: flexible operation and efficiency insights
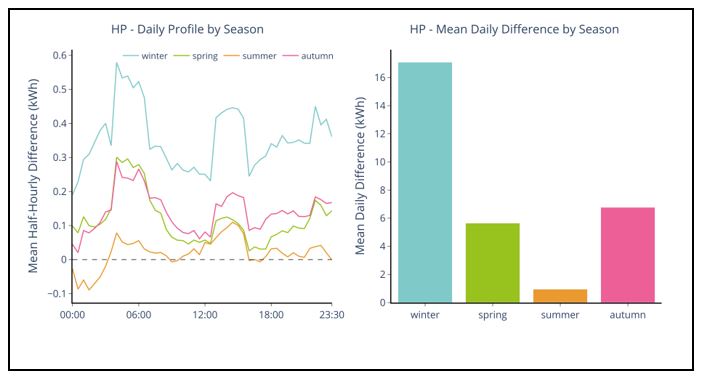
Figure two: Difference in energy import attributed to heat pump operation
Demand profile: Heat pump consumption shows elevated demand throughout the day with two distinct peak periods: 3:30-6:30 and 12:30-15:30. This pattern suggests widespread adoption of time-of-use tariffs, with systems performing pre-heating and/or hot water cycles during lower-cost periods.
Operational flexibility: The demand pattern indicates significant load-shifting capability within heat pump installations, suggesting potential for demand response applications beyond current smart tariff optimisation.
Seasonal analysis: Summer consumption, representing primarily domestic hot water load, indicates approximately 75 litres hot water usage per household per day (assuming 45°C water temperature and coefficient of performance of 2.8).
Solar PV: grid import reduction and LCT adoption
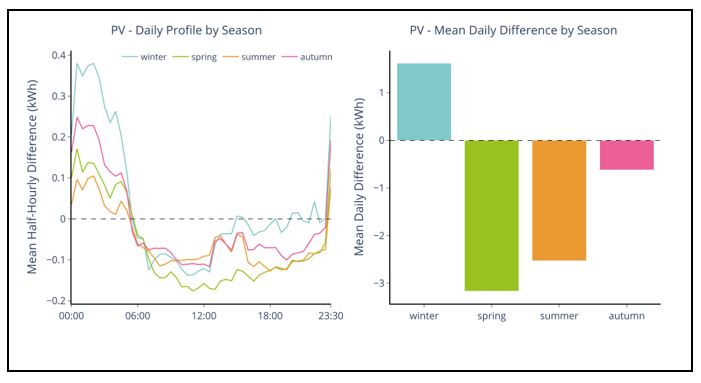
Figure three: Difference in energy import attributed to solar panel installations
Expected impacts: As expected, daytime grid import reduction aligns with solar generation profiles, with peak impact in the middle of the day across all seasons.
Grid import vs. generation: Our analysis captures grid import reduction rather than total generation. For comprehensive impact assessment, export data could be used to calculate net contribution to local grid balance. The Living Lab has also recently added functionality to collected data from PV inverters – so we hope to have generation data for many homes in the future.
Data quality insights: Our method reveals unexpected overnight consumption increases, likely indicating undisclosed EV charging and/or home battery installation. We anticipate these changes in the homes’ technologies are likely to have occurred after they completed their Living Lab profiles. This highlights the challenge of maintaining accurate technology databases in rapidly evolving markets as well as rising adoption of LCTs.
Battery storage: arbitrage behaviour and seasonal optimisation
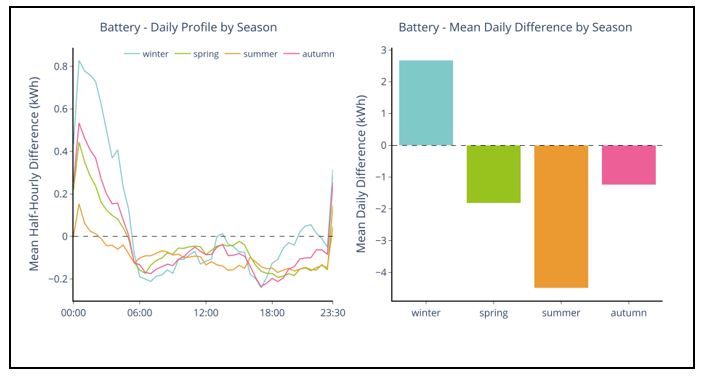
Figure four: Difference in energy import attributed to home battery utilisation
Charging patterns: Battery-equipped homes show strong overnight charging peaks across autumn, winter, and spring, consistent with energy arbitrage behaviour on time-of-use tariffs.
Summer operation: Reduced overnight charging and lower overall daily consumption in summer reflects solar-battery synergy, with daytime solar charging reducing grid dependency.
System contribution: Homes with batteries consistently show lower total daily grid consumption across three seasons. In this dataset, batteries are installed alongside PV and therefore allow homes to increase self-consumption of their generated energy. Winter energy consumption sees an increase – we suspect this is not a true increase in consumption, rather we expect these batteries are performing arbitrage, importing when energy is cheaper and exporting later – but as we are only using import data we cannot verify this. (The Living Lab will be adding the capability to capture export meter data in the near future).
Grid planning implications
Peak demand timing: The data reveals technology-specific contributions to domestic consumption peaks. EVs and batteries create overnight peaks and heat pumps show flexible demand patterns – this gives clear evidence of consumer response to price signals and indicates the potential for more sophisticated demand response mechanisms. In addition, the combination of solar and battery shows an overall decrease in energy consumption in three seasons while creating controlled off-peak demand.
Seasonal load factors: All technologies show pronounced seasonal variation, with winter unsurprisingly representing the critical design case for network capacity planning. The compounding effect of multiple technologies suggests significant local network impacts in high-adoption areas which will be more significant during winter.
Future system considerations
This real-world data demonstrates that low-carbon technology adoption is fundamentally reshaping residential demand profiles. The shift from passive consumption to active load management is already evident, with consumers responding effectively to existing price signals.
For system operators and planners, the key insights are:
Technology impacts are highly seasonal and time-dependent
Daily and seasonal demand trends are similar across technologies suggesting multiple technologies may have compounding impact.
As LCT adoption accelerates, understanding these consumption patterns becomes critical for network reinforcement planning, generation adequacy assessments, and the design of future flexibility markets.
The value of real-world data
Energy Systems Catapult’s Living Lab is a trials and data facility of over 5,000 diverse UK households who help us understand changing energy demand, consumer needs, and system impact. Our Living Lab unlocks the value of real data from actual consumers allowing the insights we present here and avoids relying on theoretical models. The behaviour of real households is hard to predict and collectively can impact the energy system in unanticipated ways. If you’d like to discuss trialling new innovations or accessing home energy data please contact the Lab team.
More information
This analysis uses DCC smart meter import data with 90%+ completeness over 365+ days. Technology classifications are based on self-reported household surveys. While the methodology controlled for technology combinations, other household characteristics (size, occupancy, socioeconomic factors) are not controlled for in this analysis. Living Lab participants are self-selected and therefore may be more engaged with their LCTs than average consumers.
We counted homes as having an EV if they had both a charger and a plug-in car (either full battery electric or plug-in hybrid). For solar, we only included photovoltaic panels (a few homes in the Living Lab have wind turbines, but too few to analyse meaningfully). Heat pump homes included any type of heat pump, whether as the sole heating source or alongside other systems. Battery homes were any having declared a home battery, either as the only energy storage or in combination with other energy storage technologies.
Living Lab
Test, trial and refine your clean energy products, services, and policies with real people in real homes
Independent thought leadership and practical expertise that harnesses digital and data innovation to tackle the hardest challenges on the way to Net Zero.