What can the Living Lab tell us about home energy technology adoption?
Claire Rowland, Senior Manager for Living Lab at Energy Systems Catapult, explores how early adopters are combining low-carbon technologies in their homes and what it means for future mainstream adoption
In the next ten years, the journey to home electrification will begin for millions of UK households – and how that journey unfolds and the combination of technologies installed will matter enormously.
We analysed how low-carbon technologies (LCTs) cluster together in over 5,000 Energy Systems Catapult Living Lab homes. For each individual technology, the Living Lab is about a decade ahead of the wider UK population in terms of adoption rates. But the really interesting finding is how technologies combine:
Electric vehicles (EVs) and solar are common entry points.
Batteries almost always follow generation.
Heat pump owners have typically already adopted other LCTs.
Over half of our LCT homes have multiple technologies.
None of this is counterintuitive but national statistics don’t track these patterns. Our data shows how the adoption of multiple devices in homes may play out, which is relevant for grid planning and policy.
What did we do?
The Energy Systems Catapult Living Lab is a trials and data facility comprising over 5,000 homes across the UK. Many are equipped with low carbon technologies (LCTs) like EVs, solar panels, batteries and heat pumps.
Those who have joined the Living Lab span a wide range of locations and demographics – including people with health conditions and those who struggle to pay their bills – living in all different types of houses.
But compared to the UK population, the Living Lab contains a high proportion of home equipped with LCTs. (This is appropriate, as a core theme of our work involves understanding future energy demand from electrification. But when we run trials, we can recruit subsets of consumers who are representative of the groups needed by the research from within the wider Living Lab pool, and beyond.)
Much of our work focuses on the energy consumption data we collect. For example, using it to understand how demand is changing as homes electrify. But recently we’ve been wondering to what extent the patterns of LCT ownership in Living Lab homes might also provide a snapshot of the future? Could they help us predict how national UK adoption may grow?
We’ve analysed technology combinations across our participant base and compared adoption rates with national statistics.
The results indicate how ‘far ahead’ Living Lab households are compared to the UK as a whole, and how the journey to home electrification might unfold for millions of UK homes in the coming decade. Crucially, where UK national statistics currently only track adoption of individual LCTs, our data shows something new: how homes adopt technologies in combination.
A snapshot of tomorrow’s households
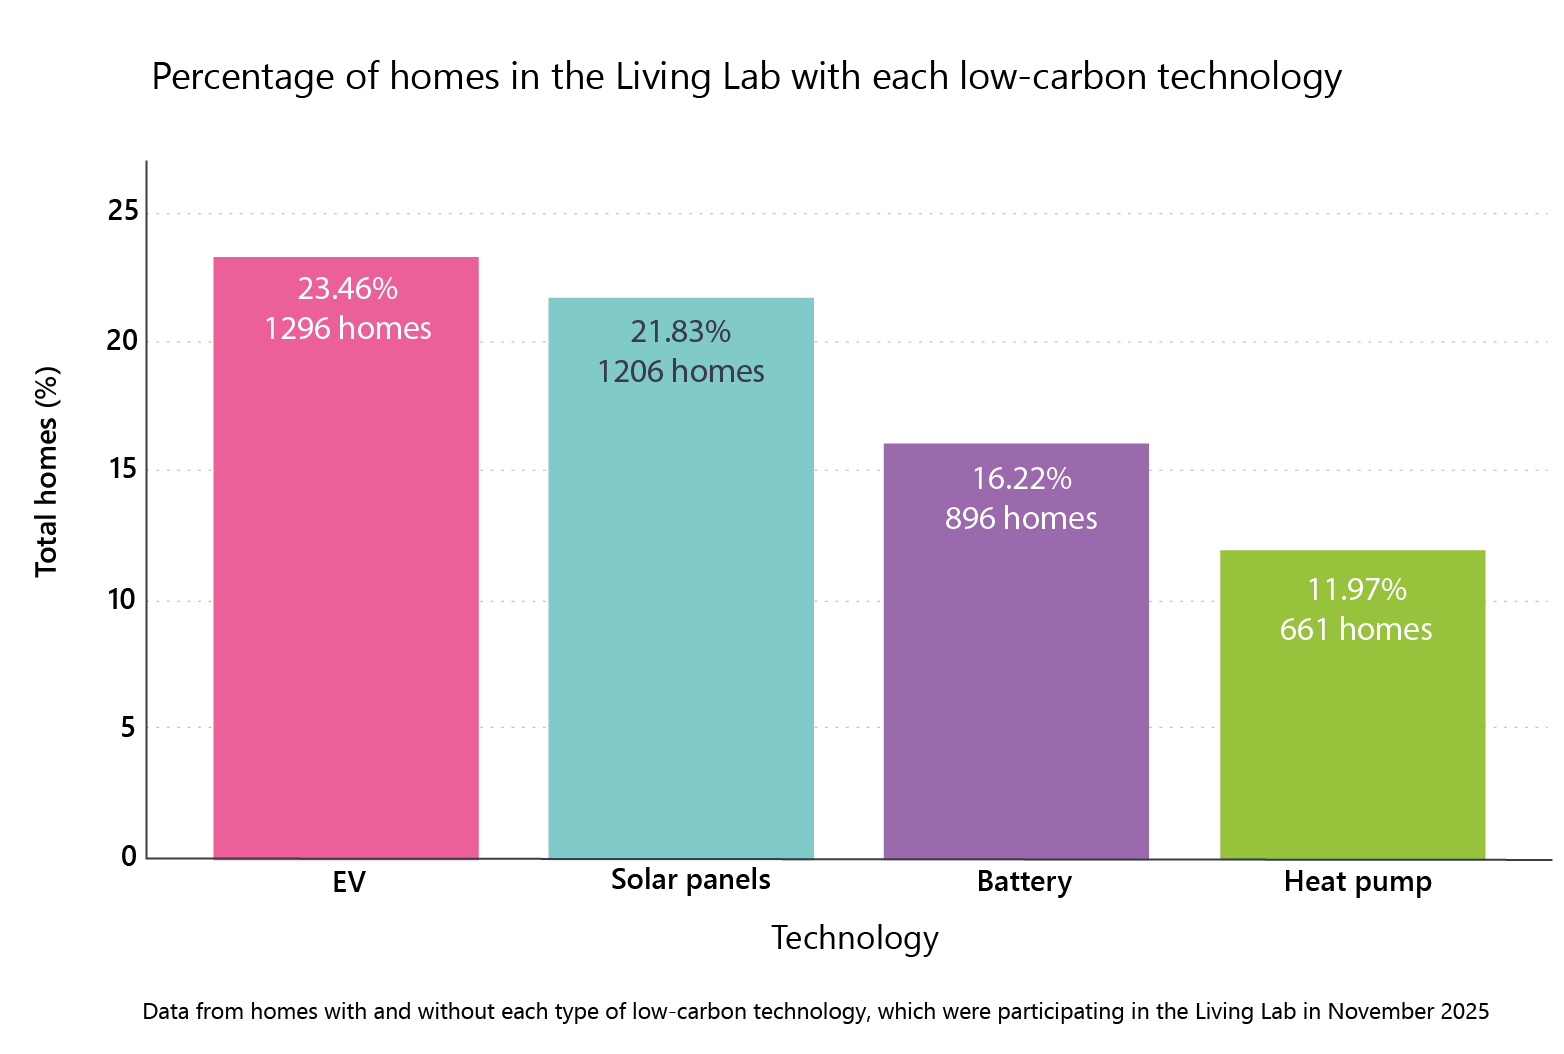
The chart below shows the percentage of Living Lab homes with a full battery EV and charger, solar panels, battery or heat pump. EVs and chargers are the most widespread, closely followed by solar panels, and then smaller proportions of homes with batteries and heat pumps.
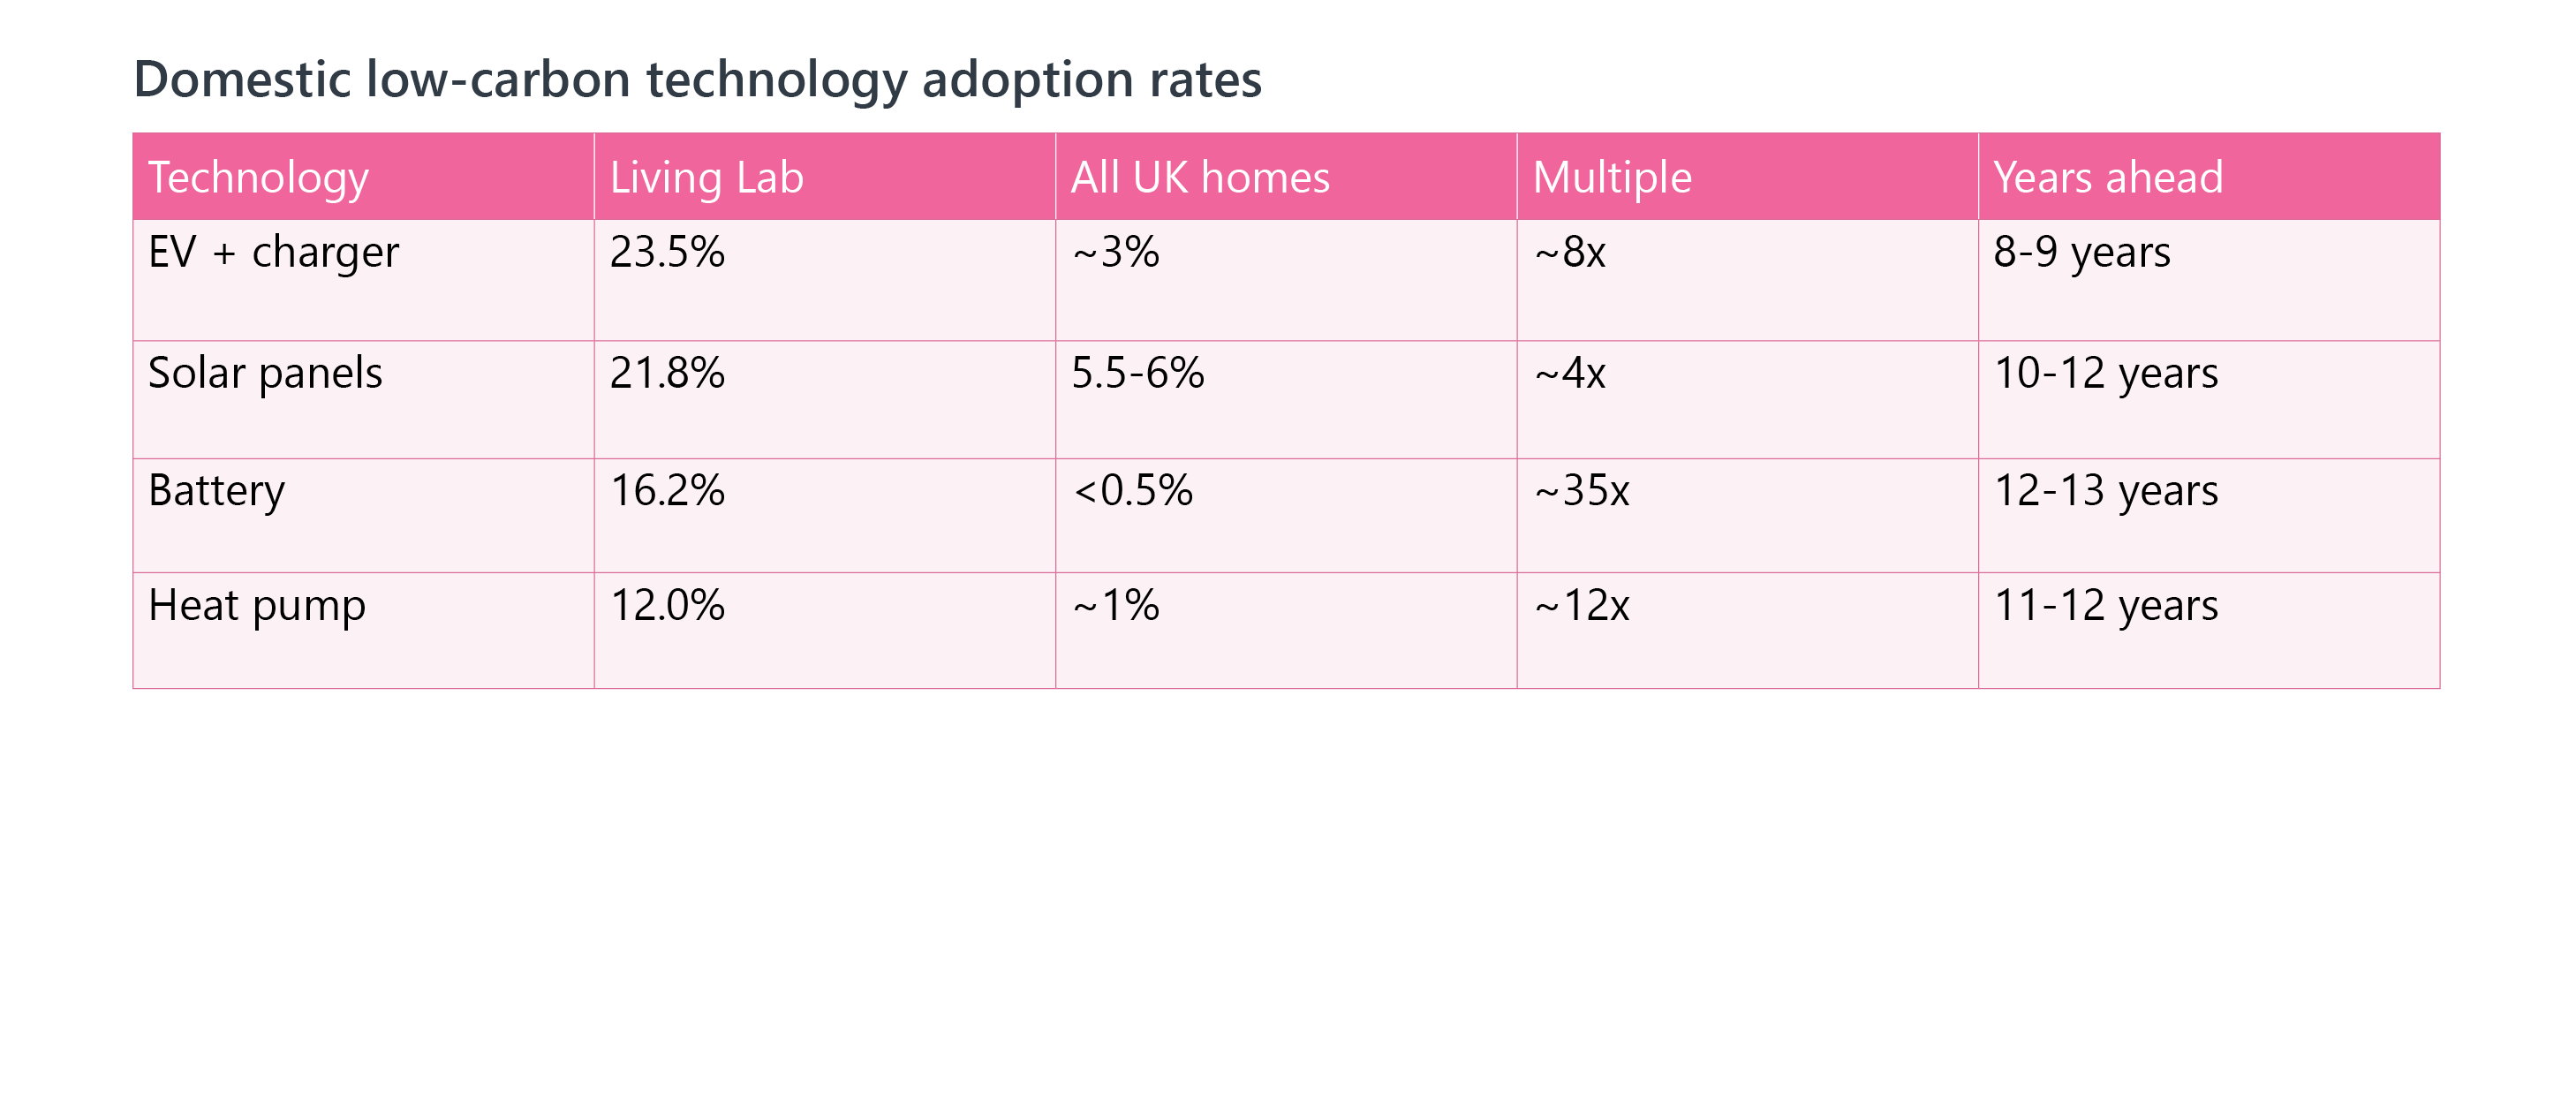
The table below compares Living Lab adoption rates (November 2025) with the latest national figures from the English Housing Survey (2023-24), MCS Data Dashboard (via published analysis) and ZapMap. The ‘years ahead’ estimates use compound annual growth rates derived from recent installation trends: approximately 11% for solar panels, 20-22% for heat pumps, 35-55% for batteries (with significant uncertainty), and 35-40% for EVs.
It’s worth noting these projections assume constant growth rates, which is unlikely in practice. Growth may accelerate (due to policy, falling costs) or decelerate (market saturation, grid constraints). The estimates should be treated as indicative rather than precise forecasts. (See our data sources here).
Despite very different market dynamics and growth trajectories Living Lab participants are roughly a decade ahead in their adoption of each of the four technologies.
This suggests our participant base, while self-selected (many of our participants have joined the Living Lab on their own initiative), may offer a reasonably balanced snapshot of the future uptake of LCTs by UK households.
But adoption rates for individual technologies only tell part of the story. National statistics – and the energy demand projections built on them – don’t currently track how technologies appear in combination. Yet many homes have more than one LCT. Could Living Lab data help us understand and predict these multi-technology patterns?
Entry points: which technologies come first?
Of the 2,090 Living Lab homes with at least one LCT (38% of the total), the most common configuration is EV only: 568 homes, or 27% of all LCT homes. This suggests EVs may be a common ‘entry point’ to home electrification. In recent years, EV adoption has been fuelled by strong tax incentives, such as benefit-in-kind rates on company cars, road tax and low emission zones.
The second most common single-technology configuration is solar only: 216 homes (10% of LCT homes), making it another significant entry point. Again, the motivation is primarily financial. Although export rates (paid to consumers to export electricity to the grid) have fallen in recent years, rising electricity prices have made home generation a compelling way to save money on bills.
By contrast, battery-only homes are rare: just 41 households (2% of LCT homes). A striking 96% of homes with batteries also have at least one other technology, and 89% have solar panels specifically. As you might expect, batteries are almost never a starting point; they’re something people add once they have generation to store. This pattern is stronger in the Living Lab than nationally. 66% of our solar homes have a battery, compared to 43% in national surveys.
Heat pump-only homes are also relatively uncommon at just 167 homes (8% of LCT homes). Most heat pump owners have other technologies. 79% have at least one other LCT, 62% have solar, and 62% have an EV. This suggests that early heat pump adopters tend to be households already engaged with electrification, rather than those making it their first step.
I should add a quick note on interpretation. Our data is a snapshot of households in the Living Lab at a point in time. We don’t ask participants when they acquired their kit, so cannot track adoption sequences. We infer that EVs and solar are ‘gateways’ to further adoption. Anecdotally, we often hear of consumers getting an EV, having a positive experience, and then becoming interested in electrifying more of their home, which supports this hypothesis. But it’s also possible that EVs and solar might simply be the most common technologies.
Future analysis that tracks adoption over time, or simple consumer research, would test this.
Combinations: how technologies cluster together
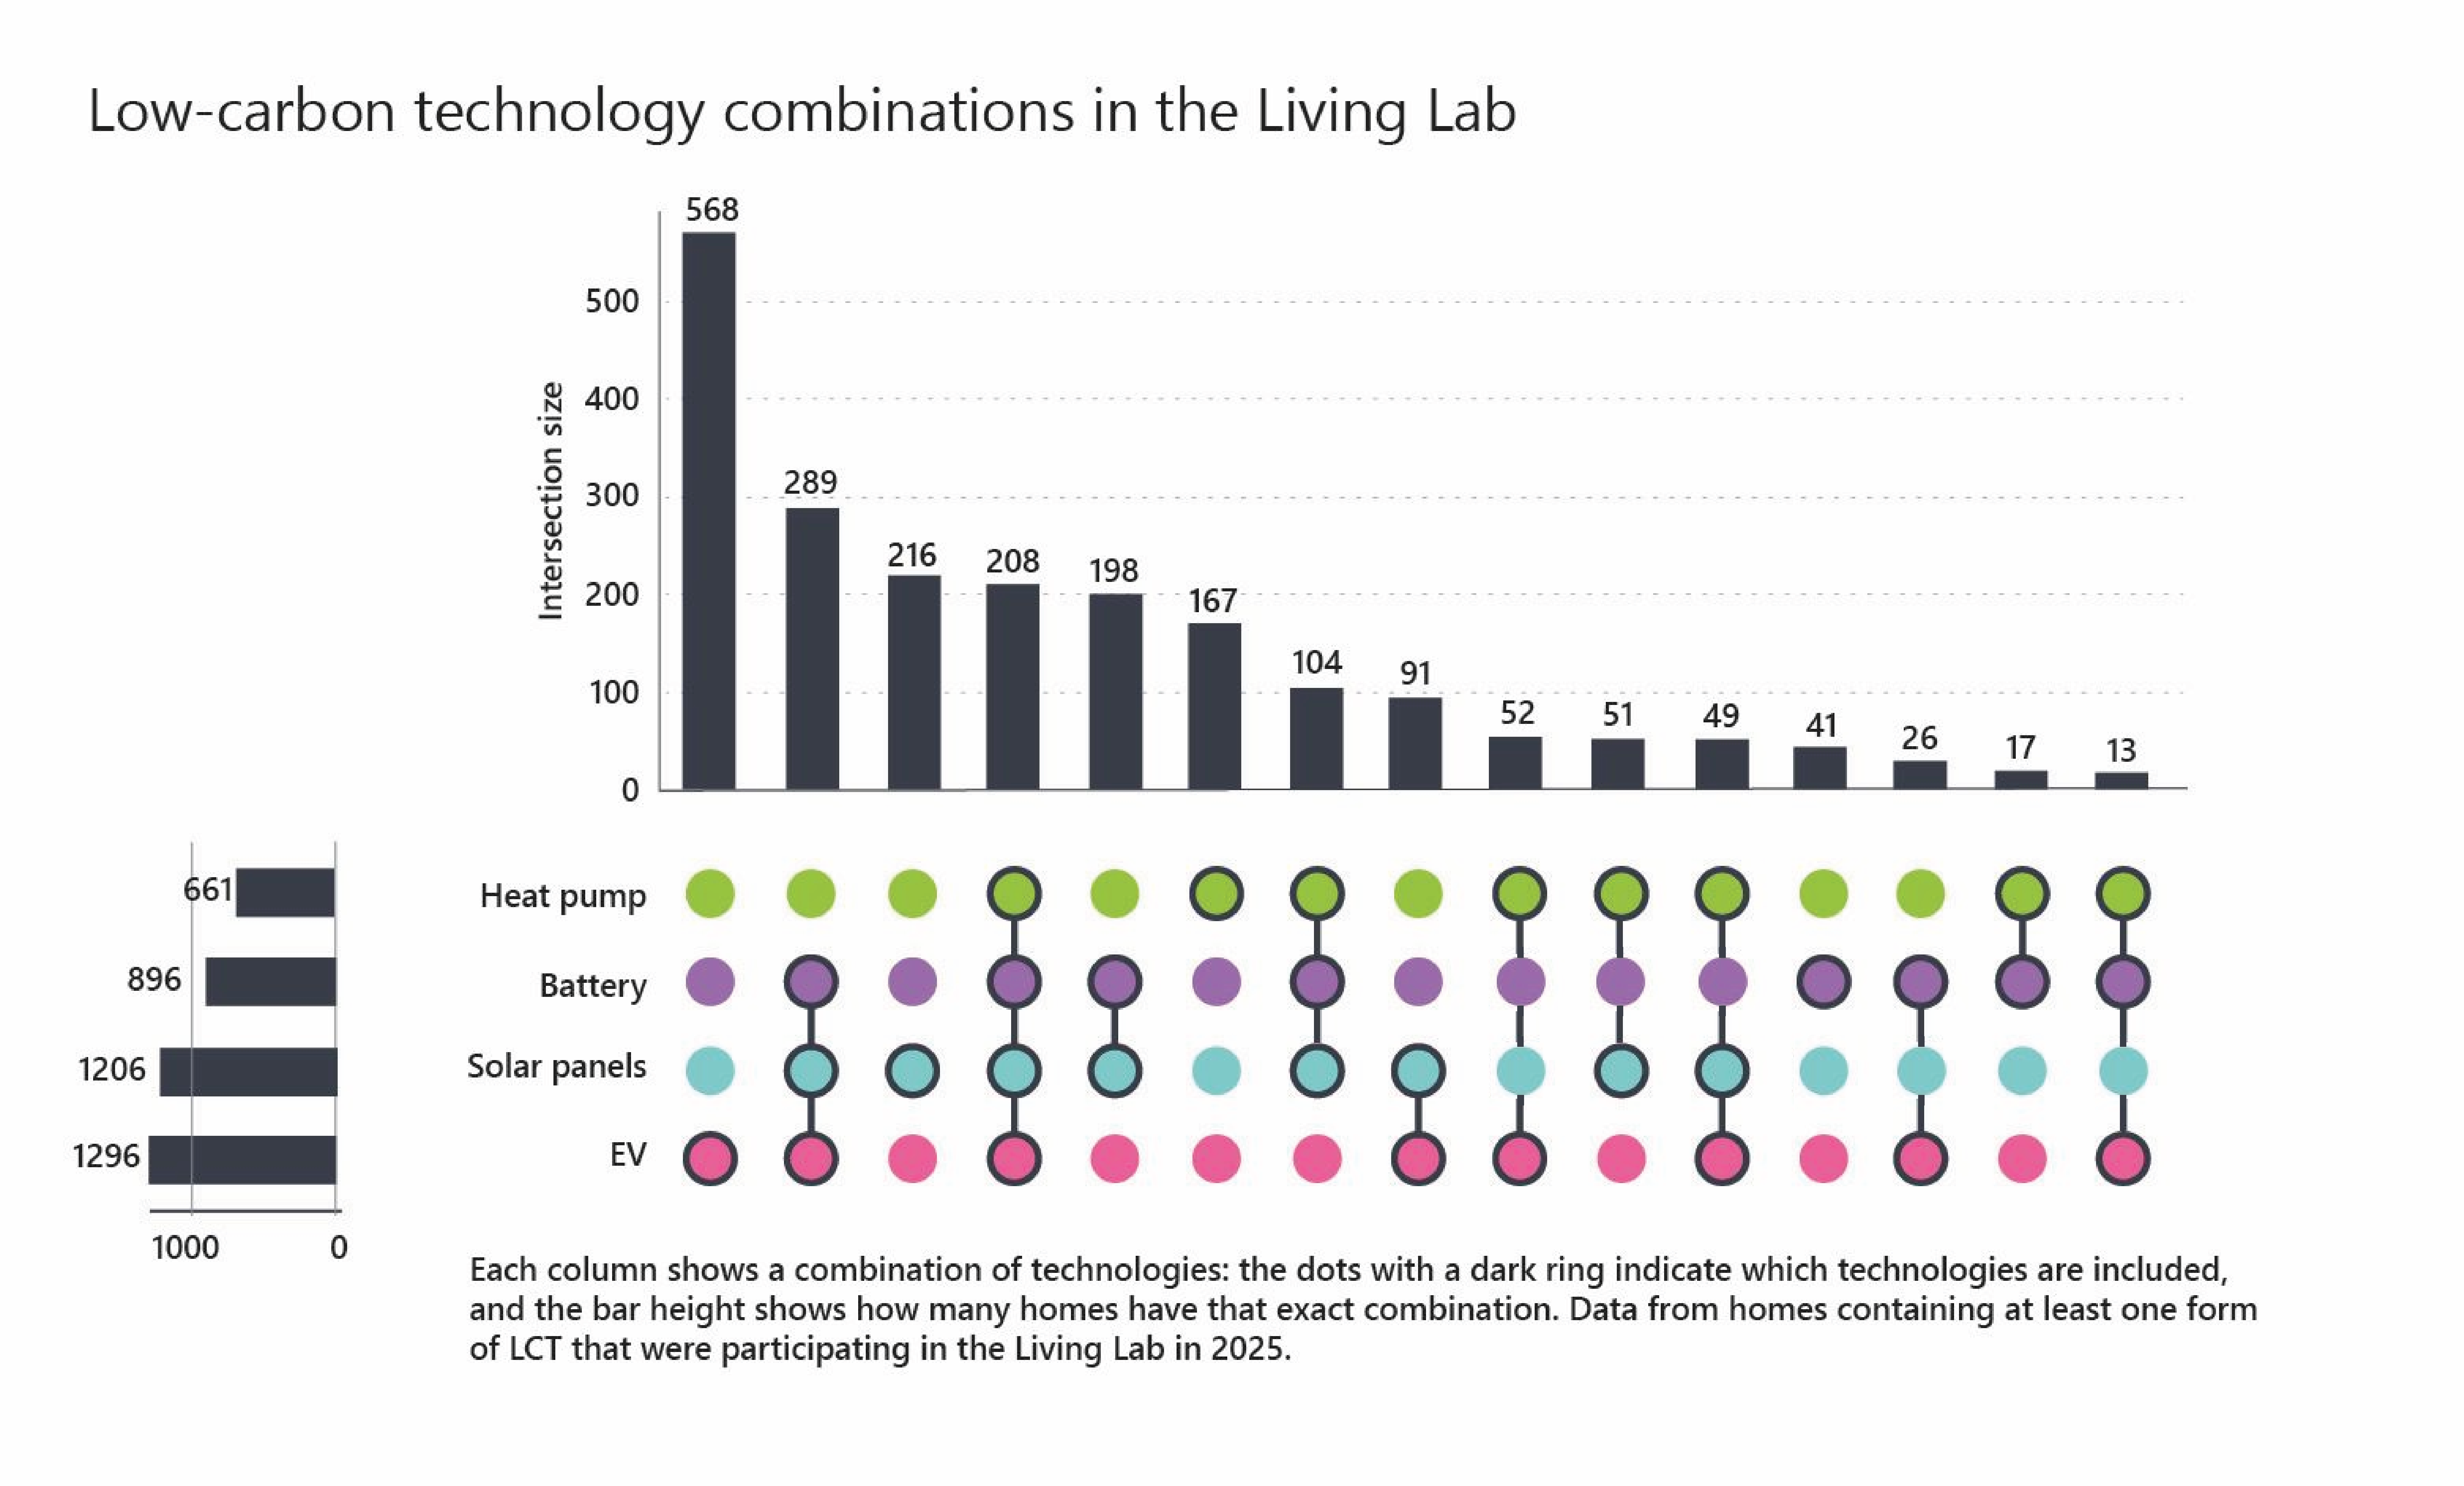
The chart below shows how the four technologies combine across Living Lab homes.
The most common multi-technology configuration is EV + solar + battery, which was adopted in 289 homes (14% of LCT homes). This combination makes intuitive sense. Solar generates electricity during the day, the battery stores what isn’t used immediately, and the EV charges when surplus power is available. It’s a package optimised for self-consumption and reducing reliance on grid imports.
Adding a heat pump to that trio creates the ‘full stack’ household. This is our second most common combination with 208 homes (10% of LCT homes). These homes offer a glimpse of high-electrification living. They have substantial generation, storage, and two major electrical loads (heating and transport). They barely exist at national level yet, but they represent a substantial research cohort for understanding future grid demands.
Overall, 53% of our LCT homes have multiple technologies. The picture that emerges isn’t one of isolated technology decisions, but of households progressively building out their electrification capabilities. This chimes with Electrify Research‘s recent market research study, showing that owning one clean technology dramatically increases the willingness to adopt another.
What might this mean for the future?
Several patterns seem likely to play out as national adoption grows:
EVs and solar are gateway technologies. Policy incentives (for EVs) and bill savings (for solar) have driven adoption independently of other home energy decisions. Both are now mainstream. Many consumers already know someone with an EV or solar panels, which builds social proof. Once households have either technology, the case for adding others strengthens.
Batteries will follow generation. The near-universal pairing of batteries with solar suggests storage deployment will track solar panel adoption, as homes seek to maximise self-consumption and evening use.
Heat pumps may cluster with broader electrification. If the Living Lab pattern holds, heat pump adopters will often be households with other LCTs already. This has implications for grid planning as heat pump demand may concentrate in homes which already have significant electrical loads.
Multi-technology homes will become the norm. Over half of Living Lab LCT homes have more than one technology. System planning and designing for these ‘stacked’ households – understanding their demand profiles, flexibility potential, control needs and user experience – will become increasingly important.
There is a huge opportunity for households to participate in and take advantage of energy system flexibility, which in turn opens the door for home technology innovators. In our recent Innovating to Net Zero report, we found that homes could provide around 76 GW of flexibility by 2040, but this depends on innovators developing and scaling the technologies and services that make participation accessible and appealing to the broadest possible audience.
These can be single technology solutions, such as the Homely heat pump optimiser trialled in our Inclusive Smart Solutions programme (ISS), aimed at low income and vulnerable users. For homes with multiple LCTs, home energy management systems can optimise energy use across the whole home, enabling homes to make best use of home generation and financial incentives to flex.
What else should we keep in mind?
Many of the LCT homes in the Living Lab are owner-occupiers. This may affect how these patterns translate to the rental sector, where landlord incentives and split responsibilities create different dynamics.
Early adopters may also use technologies differently from mainstream consumers. They tend to be more engaged, more technically confident, and more willing to experiment.
While technology adoption in the Living Lab is ahead of national averages, the usage patterns we see from early adopters (for example, adoption of dynamic tariffs) may not translate to the mass market.
However, as consumers become more confident with new technologies – and where strong financial incentives exist – we may see mass market usage patterns become more sophisticated.
For those interested in the geographic distribution of homes with different LCT combinations, our interactive map tool shows approximate locations of homes in the Living Lab with specific technologies and combinations.
Let’s solve it together
The Living Lab offers a unique window into the future of UK homes. This covers not just adoption rates, but real energy consumption data from real households living with these technologies today.
Whether you’re a policymaker seeking evidence on how electrification is changing demand, a network operator planning for clustered LCT loads, a researcher studying consumer behaviour, or a product developer wanting to test innovations with real people in real homes, the Living Lab can help.
We provide access to smart meter and LCT usage data, and the ability to run trials with engaged participants. To discuss how the Living Lab can help you test and derisk home energy coordination challenges, click on the ‘get in touch’ button below to start a conversation and take the next step.
Want to know more?
Find out more about how Energy Systems Catapult can help you and your teams
Get in touch
Want to know more?
Find out more about how Energy Systems Catapult can help you and your teams