Want to know more?
Find out more about how Energy Systems Catapult can help you and your teams
Get in touch
Want to know more?
Find out more about how Energy Systems Catapult can help you
Energy Systems Catapult and Blake Clough Consulting adapted NESO’s 36-bus model of Britain’s National Electricity Transmission System to show what it could potentially look like by 2050. Then we used that model to study how nuclear cogeneration could impact the electricity transmission network.
The work shows how reduced-order models (a simplified representation of a more detailed network model) can help innovators, network planners, technology developers and researchers quickly test strategic questions before starting more detailed studies.
Full transmission models are still needed for detailed planning and compliance, but this project shows how reduced-order models can offer valuable network insights for innovation studies.
To learn more, we spoke with Toby Rowles from Blake Clough Consulting and Charmalee Jayamaha from Energy Systems Catapult.
Charmalee: We adapted NESO’s 36 bus model – which split the electricity transmission system into 36 zones to explore how the electricity transmission network might look in 2050 at a realistic but strategic level.
The 36 bus model is a simplified version of the transmission system. It lets us test strategic power-flow questions faster than using a full detailed network model.
Since the original model showed the system as it was over ten years ago, we worked with Blake Clough Consulting to update its assumptions and structure. This way, it represents a future network but stays clear and efficient for scenario testing. These updates let us see how different uptake levels and locations of nuclear cogeneration could change power flows across the transmission system boundaries.
This is important now because Britain’s electricity system is changing rapidly. With rising demand, new technologies like small modular nuclear reactors (SMRs), locational challenges and uncertain development pathways, we need tools to assess long-term options efficiently while still understanding key network behaviour.
Charmalee: This work should be of interest to researchers, network organisations, energy system modellers and innovators who need to understand how future projects will interact with a constrained power system.
Reduced-order power system models can add value by helping specialist teams test strategic choices sooner and explain likely network impact more clearly. When used in the right context, this type of modelling can show how future heat networks, industrial sites, data centres, public-sector estates or flexible demand might interact with the wider electricity system.
Early network insight can show where innovators and their technologies and services might add value, where they could put pressure on the network, and where more detailed analysis is needed before making such decisions.
The Nuclear Cogeneration project is a good example of this in action. It shows how strategic modelling can help us look at the possible role of new nuclear technologies in Britain, especially as government and industry consider the next generation of SMRs and advanced modular reactors.
More generally, it highlights why it’s important to consider network impacts early if new low-carbon technologies are to grow in a way that supports the wider energy system.
Charmalee: We wanted to see how different uptake levels and locations of nuclear cogeneration could interact with the future transmission network.
To do this, we used results from our Energy System Modelling Environment (ESME) to create different uptake scenarios. We then needed a representative model of the 2050 transmission system to test those scenarios from a power systems perspective.
We converted the ESME results into a format that could be tested on the 36-zone transmission model. We then broke down the scenario results across the model’s zones for Blake Clough to consider in its network modelling study.
Toby: For the 2050 power system, we started with the NESO’s 36 bus model, which represents the network as it stood in 2013. To make it suitable for a 2050 study, we made substantial updates to the topology, such as adding new HVDC links, voltage uprating, additional circuits and offshore interconnection.
We also revised and updated assumptions about generation, demand, interconnectors, boundary capabilities and line ratings.
This helped the model reflect a realistic 2050 power system while staying practical for strategic analysis.
Toby: After upgrading the model, we used it to run DC load flow studies. We began with a 2050 base case without nuclear cogeneration, then tested several scenarios with increasing levels of nuclear deployment.
The main focus was on how power flows changed across major transmission boundaries, especially the key north-south corridors. This helped us see if certain nuclear cogeneration scenarios could reduce or increase renewable curtailment in different regions.
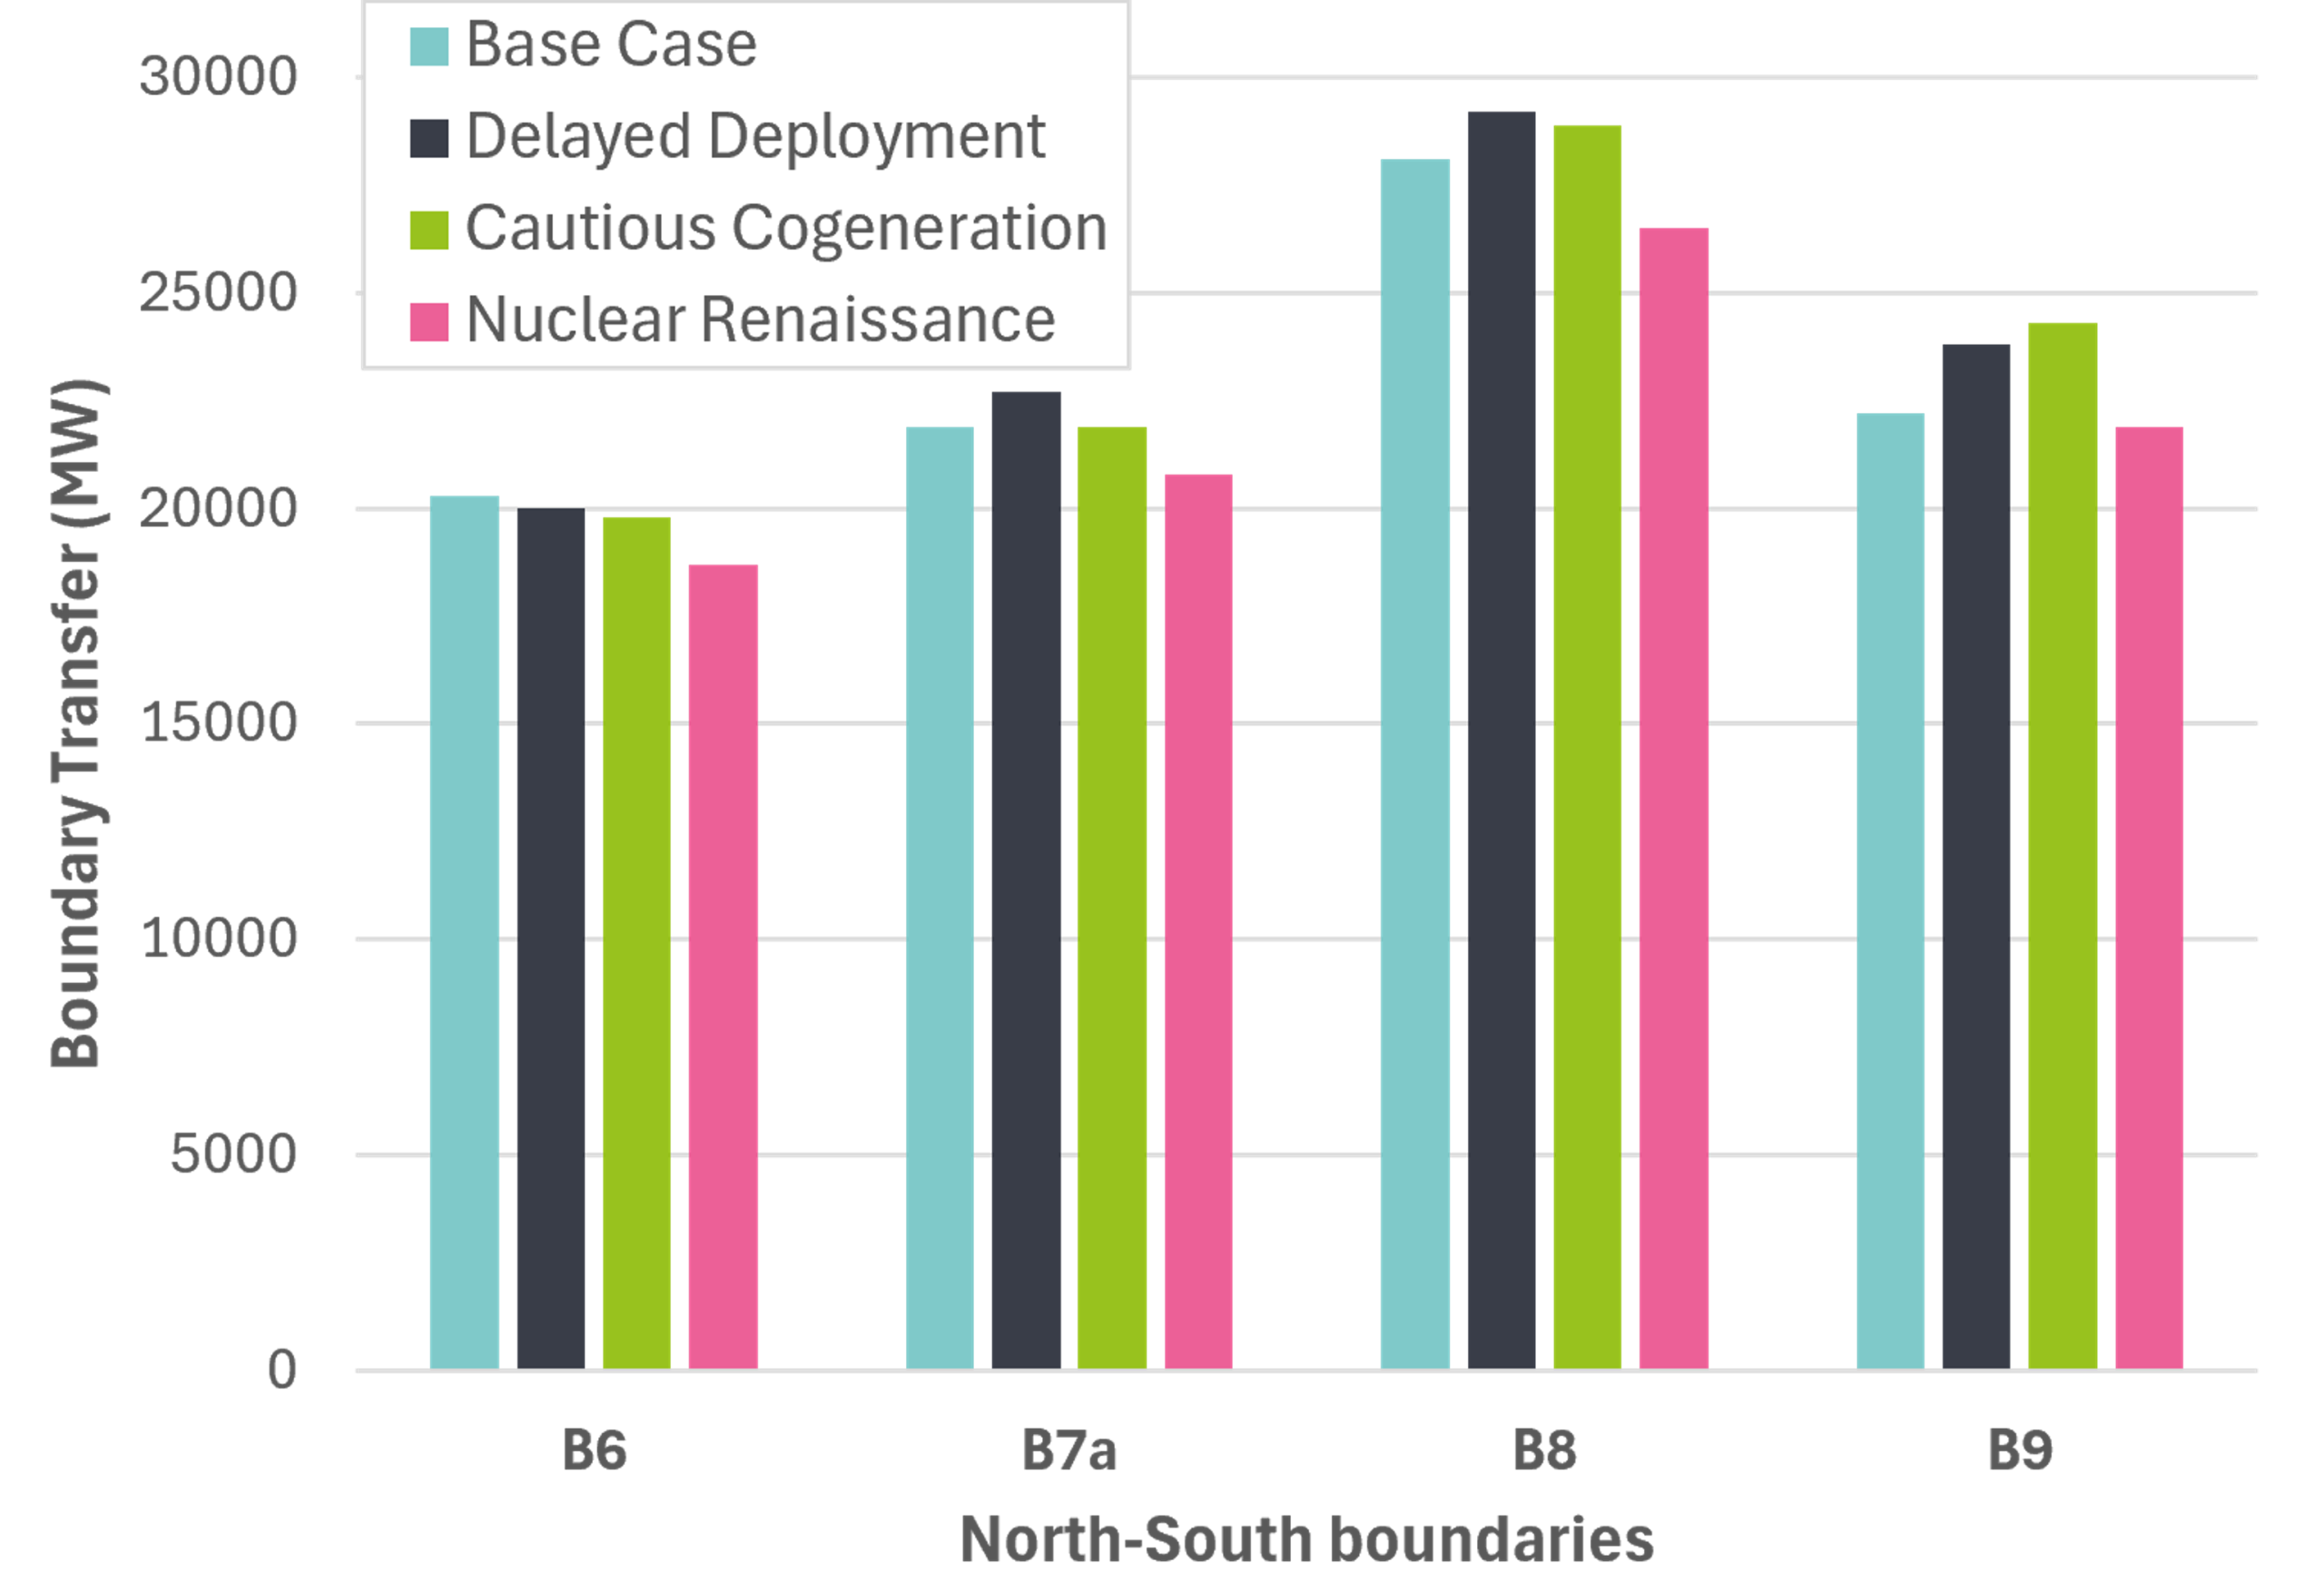
The model compares power flows across four major north-south transmission boundaries under different nuclear cogeneration scenarios. Lower bars mean less power needs to be transferred across that boundary. The high-uptake Nuclear Renaissance scenario shows reduced flows across all four boundaries, especially B6 and B8. This suggests that locating more firm low-carbon generation closer to demand could ease pressure on key parts of the transmission network
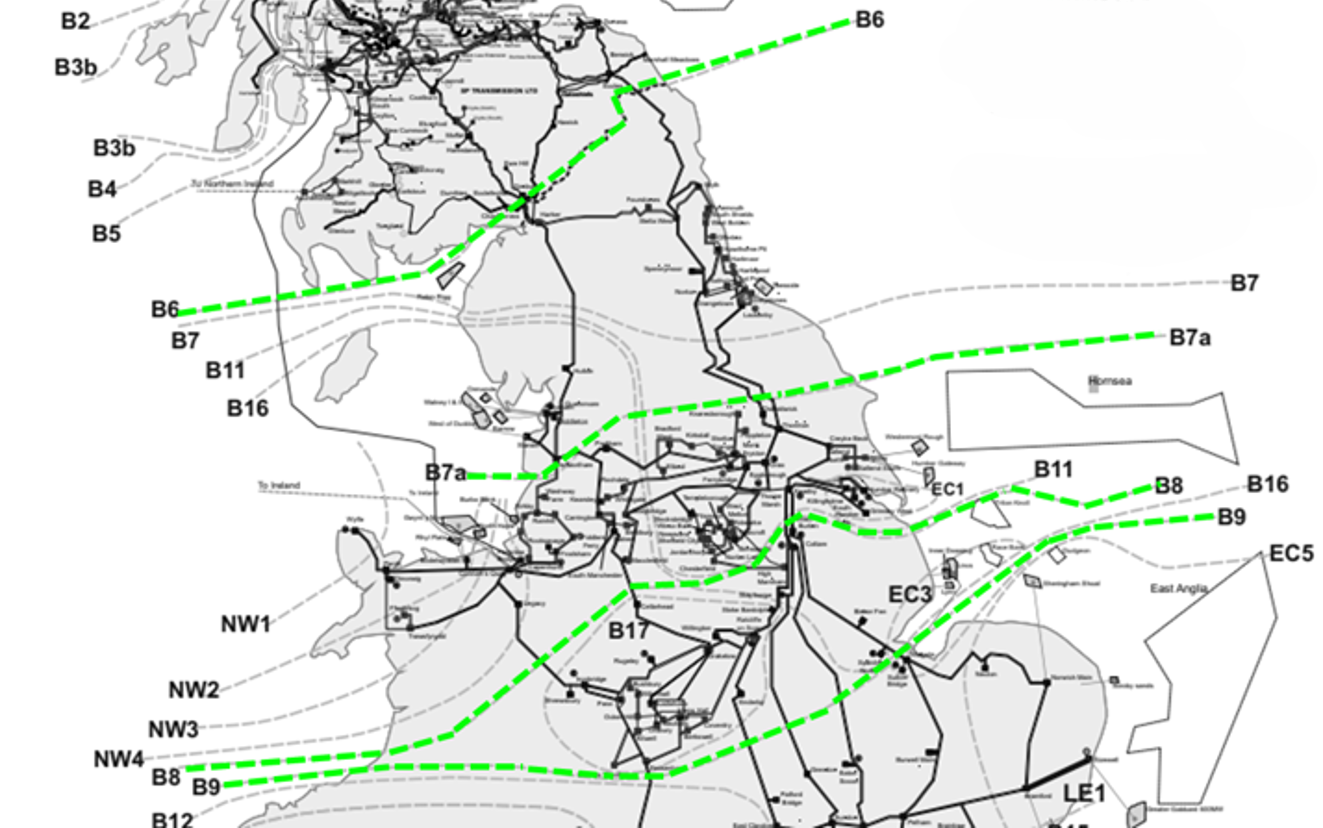
Boundaries B6, B7a, B8 and B9 are key north-south transfer routes on the GB transmission network. In the high nuclear cogeneration scenario, power transfers across these boundaries drop because more generation is placed closer to where it is needed
Toby: The full transmission network model is essential for detailed planning, compliance work and understanding local network issues, but it’s not always the best starting point for early-stage innovation studies.
It contains a huge amount of detail, which makes it more time-consuming to configure, run and interpret, especially when you want to compare several long-term scenarios.
The 36 bus model gives a simpler representation of the system that is much faster to work with and easier to explain. It’s not a replacement for the full model of Britain’s transmission system, but it’s very useful for exploring strategic questions as we did in this project.
Toby: The main advantage of reduced-order models is that they make it easier to compare different scenarios, test sensitivities and communicate results clearly. In innovation studies, that can be especially helpful when you need to link whole system scenarios with transmission-level questions without jumping straight to a fully detailed network model.
Charmalee: The 36 bus model enabled us to see how the placement and size of nuclear cogeneration can change boundary transfers and network flows. This insight is important, because our final report shows a promising future for power grids, where established technologies and groundbreaking solutions like nuclear cogeneration work together.
The value of this type of model is not in giving final investment answers, but helping us spot which scenarios, locations and assumptions need more detailed study before moving forward. Innovation consortia looking at new generation technologies, business models, locational impacts and testing different scenarios could benefit hugely from reduced order power systems models to discover plausible innovation pathways.
Toby: Yes, definitely. Because the model is aggregated, it’s more reliable for looking at boundary-level trends than for drawing conclusions about individual circuits or substations. The DC load flow approach also doesn’t capture voltage, reactive power or some of the operability issues that would be important in a detailed transmission study.
The model is very useful for early insights and sensitivity testing, but it shouldn’t be used to make final decisions about specific reinforcements without more detailed analysis.
Charmalee: As Toby mentioned, this 36 bus model study does not consider system inertia constraints or wider operability considerations. Synchronous nuclear generation can add inertia and could also provide wider operability and flexibility benefits to the transmission network including reactive power support and fault level support.
These services will likely become more important as the system relies more on inverter-based generation and as location-specific operability needs grow. Investigating those benefits properly would require a more detailed model.
Our work explored operability and flexibility more qualitatively in the final report.
Toby: One of the main lessons was that updating the model properly is just as important as running the analysis. The 2013 model is a useful starting point, but for a 2050 study, the assumptions on network topology, boundary capability, generation, demand, interconnectors and equipment ratings all need to be carefully reviewed. Curtailment and network flows are highly sensitive to the forecast of the build-out of the transmission network.
Another important lesson was that the location of nuclear cogeneration can matter as much as the total amount deployed, because location shapes how power flows across the transmission network.
That reinforces the need to consider future generation, industrial demand and network reinforcement together rather than in isolation.
Charmalee: I would say the lessons are most relevant for network organisations, NESO, government policy teams, nuclear developers, local authorities and consultants working on long-term system studies.
The wider point is that nuclear cogeneration shouldn’t be treated simply as another source of electricity generation. Its value depends heavily on where it’s built, what demand it’s connected to, and whether heat, industrial use and flexibility are considered early enough in the planning process.
I would not present cogeneration as a guaranteed solution. This work shows if it’s considered early and planned well, it could help reduce some network upgrades, support system operability and offer another way to decarbonise heat. If it’s looked at too late, or only as a standalone electricity source, many of these wider benefits could be missed.
For us, the main lesson is that reduced-order models can be very useful in early-stage energy system planning. They do not replace detailed transmission studies, but they help point out the locations, scenarios and assumptions that are worthy of a closer look.
We’d welcome discussions with network companies, developers, local authorities, policy teams and other partners interested in exploring similar innovation projects using strategic network modelling to support future decision making on low-carbon generation, heat, industry and flexibility.
Start your conversation by clicking on the ‘get in touch’ button below.
Find out more about how Energy Systems Catapult can help you and your teams
Find out more about how Energy Systems Catapult can help you